Silver Price Analysis: 61.8% Fibonacci retracement probes XAG/USD sellers
- Silver fades corrective pullback near the lowest levels since April.
- Key Fibonacci retracement tests sellers amid nearly oversold RSI conditions.
- 200-DMA, previous support from November 2020 guards short-term recovery moves.
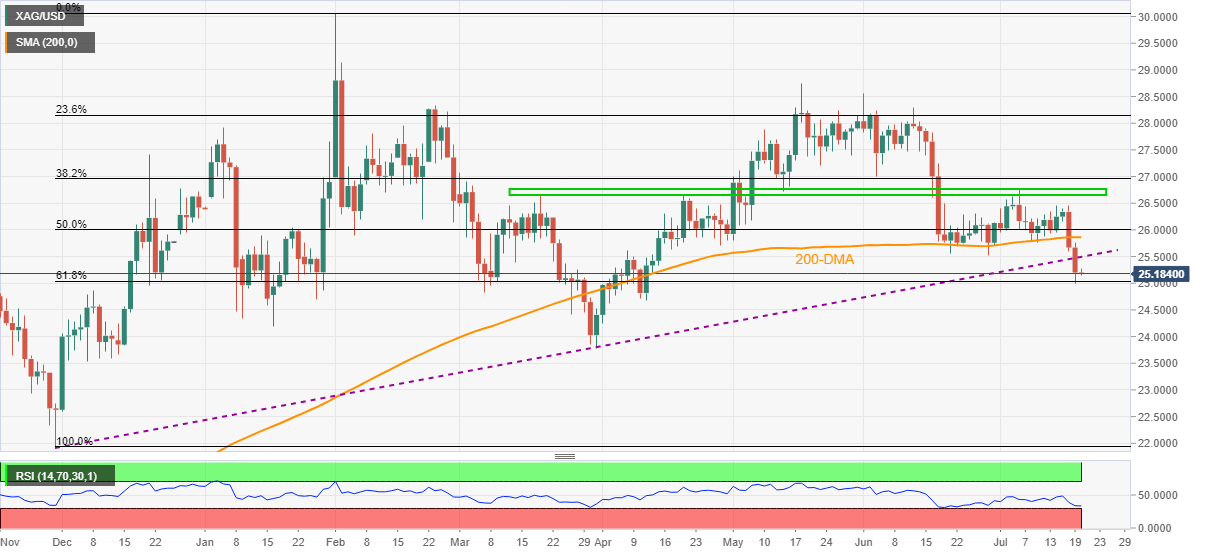
Silver (XAG/USD) struggles to defend $25.00, down 0.03% around $25.19, ahead of Tuesday’s European session.
Even so, the metal sellers need validation for further downside as RSI conditions suggest corrective pullback from the 61.8% Fibonacci retracement of November 2020 to February 2021 upside, near $25.00.
Hence, the anticipated recovery moves can initially aim for the support-turned-resistance line, surrounding $25.50, before challenging the 200-DMA level of $25.86.
During the quote’s sustained run-up beyond $25.86, a four-month-old horizontal hurdle around $26.75-80 could test the silver bulls before giving back the controls.
Meanwhile, a daily closing below the stated Fibonacci support close to $25.00 will direct bears to the $24.70 level, comprising lows marked during late January and mid-April.
Though, a clear downside past $24.70 won’t hesitate to challenge the yearly low of $23.77.
Overall, silver sellers seem tired and hence a consolidation can be expected but the overall bearish trend remains intact until the metal remains below $26.80.
Silver: Daily chart
Trend: Bearish